
Stagflation
The Oil Shock is Already in Motion

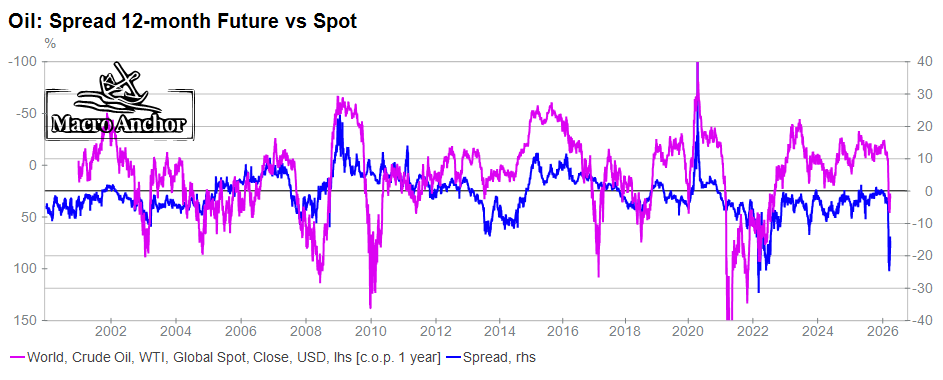
The oil market is already tightening, and the structure of the forward curve reflects that reality with unusual clarity. The first chart shows the spread between the 12-month forward price and the spot price, and what stands out is not simply that the market has moved into backwardation, but that it has remained there. This persistence signals that the system is short and that immediate access to physical barrels has become more valuable than future supply. In past cycles, this configuration has been closely associated with low inventories and rising prices, as the market begins to price scarcity before it becomes visible in headline data. The curve therefore acts as a leading indicator of physical tightening, compressing time and pulling supply forward.
This tightening moves directly into inflation through gasoline, which remains the most immediate transmission channel into the real economy. The second chart shows how closely gasoline prices track inflation, and this is well documente…
